How to Monitor DigitalOcean VPS

Monitoring server resources such as RAM, CPU, disk, and network. This is done to find out how much use of these resources. Based on the resource usage data that we get from the monitoring results, we can easily make decisions to increase or decrease server capacity, especially VPS.
Get started on DigitalOcean with $200, 60-day credit for new users.
DigitalOcean VPS users can monitor Bandwidth, CPU and Disk I/O usage via the Droplet Name->Graphs page.
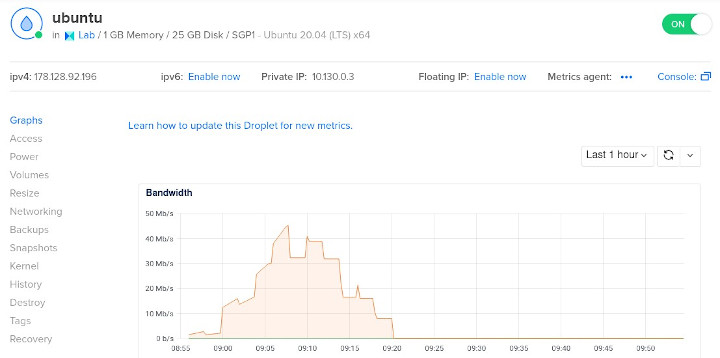
These graphs can still be added with Load, Memory, and Disk Usage monitoring by installing the Metric agent.
Install do-agent
Download the do-agent installer.
1 | curl -sSL https://repos.insights.digitalocean.com/install.sh -o /tmp/install.sh |
Run the installer.
1 | sudo bash /tmp/install.sh |
Check the do-agent installation results.
1 | /opt/digitalocean/bin/do-agent --version |
Check the Graphs page again.
Alert Policies
Alert Policies is a feature at DigitalOcean that can send notifications to email and Slack when resource usage in a droplet reaches its limit and occurs in an interval of at least 5 minutes to 1 hour.
For example, we want DigitalOcean to send a notification when CPU usage has reached the limit above 80% for 5 minutes.
Open Alert Policies, click the menu Create->Alert Policies.
At Select metric & set threshold, select CPU, is above, 80%, 5 min.
At Select Droplets or Tags, enter a droplet or tag.
At Send alerts via, check the email, and click Connect Slack if you want to send a notification to Slack.
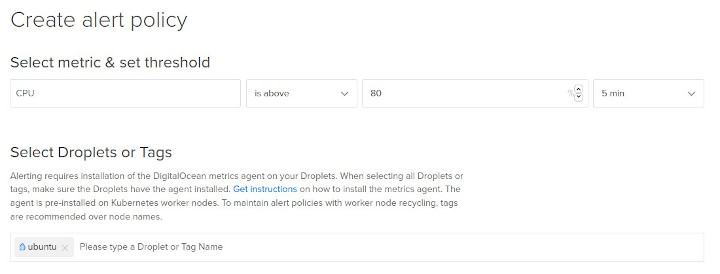
Finally, at Name and create alert policy, enter a name for the alert policy, and click Create alert policy.

Alert Policy Testing
To test the alert policy, whether it successfully sends a notification to the email or not, we have to force the CPU to work up to above 80% for 5 minutes. We can use Stress, a tool for stress testing systems, running large workloads.
Install stress on Debian or Ubuntu.
1 | sudo apt install stress |
Install stress on CentOS.
1 | sudo yum install stress |
Run stress for CPUs with 1 core.
1 | stress --cpu 1 |
Stress will make the CPU work up to 100%. See CPU usage in Graphs.
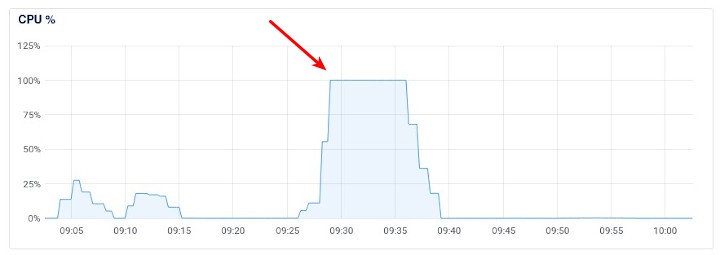
The notification will be sent after 5 minutes.

To stop Stress, press CTRL + C.
Another notification is sent when the CPU usage is below 80%.

If you found this article helpful and would like to support my work, consider making a donation through PayPal. Your support helps me continue creating useful content and tutorials. Thank you!
Donate via PayPal: https://paypal.me/musaamin

Om boleh minta tutorial untuk config dan manage san storage dell??
saya belum pernah setting produk seperti itu