How to Install Grafana for System Monitoring on Ubuntu 18.04

Grafana is an open source software for analytics and monitoring that supports more than 30 data sources. Previously I installed Prometheus on the Ubuntu server and the data will be visualized on Grafana.
0.Install Grafana
Download the GPG key and add the Grafana repository.
1 2 | wget -q -O - https://packages.grafana.com/gpg.key | apt-key add - add-apt-repository "deb https://packages.grafana.com/oss/deb stable main" |
Install Grafana.
1 | apt install grafana -y |
Activate grafana-server.
1 2 3 | systemctl enable grafana-server systemctl start grafana-server systemctl status grafana-server |
1.Disable Anonymous Registration and Access
Open the Grafana configuration file.
1 | nano /etc/grafana/grafana.ini |
Look for allow_sign_up under [users], remove ; then fill in the value to false.
1 2 3 4 5 | ... [users] # disable user signup / registration allow_sign_up = false ... |
Look for enabled under [auth.anonymous], remove ; then fill in the value to false.
1 2 3 4 5 | ... [auth.anonymous] # enable anonymous access enabled = false ... |
Restart grafana-server.
1 2 | systemctl restart grafana-server systemctl status grafana-server |
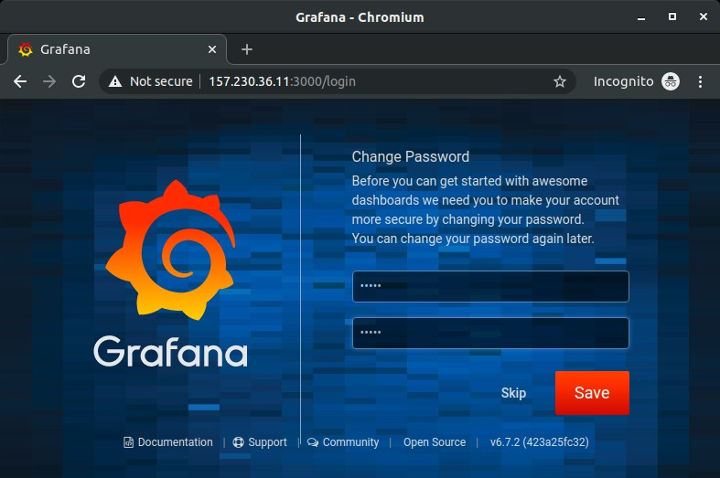
2.Update User and Password
Browse for http://SERVER-IP: 3000, login with user = admin and password = admin. After logging in successfully, you will be asked to change the admin password.
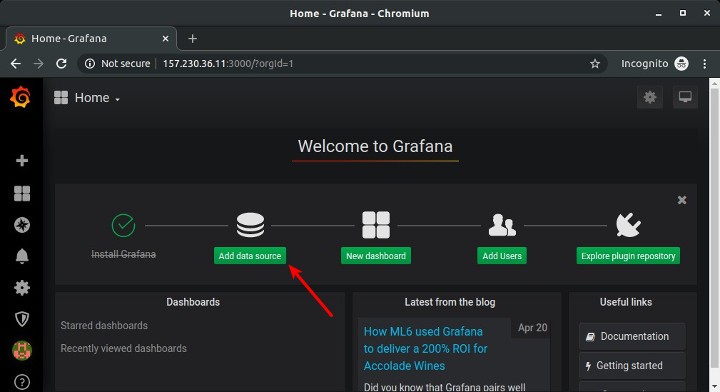
3.Add Data Source
Previously on this server Prometheus was installed. Data from Prometheus will be visualized or displayed on Grafana.
- Click Add data source.
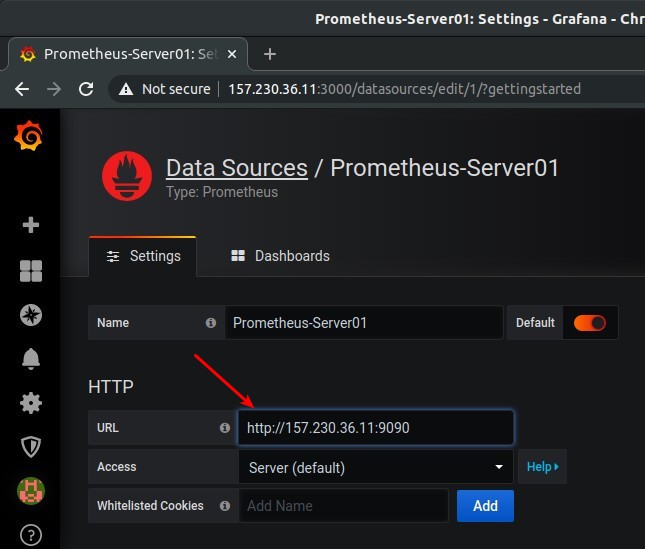
- Click Select on Prometheus.
- URL = http://SERVER-IP:9090, (Prometheus server)
- Click Save & Test.
- If successful message appears Data source is working.
4.Create Dashboard
Next create a Dashboard while creating a panel for the server status whether Up or Down.
- Click menu + Create -> Dashboard.
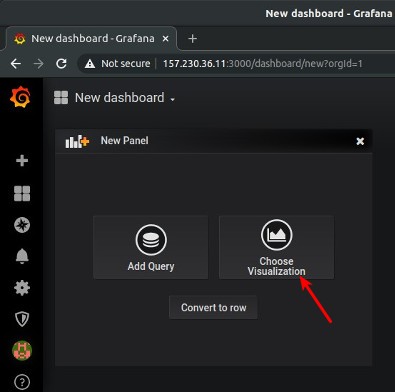
- Click Choose Visualization.
- Click Singlestat
- At Value Mappings, add Set value mappings, 1 -> UP dan 0 -> DOWN.
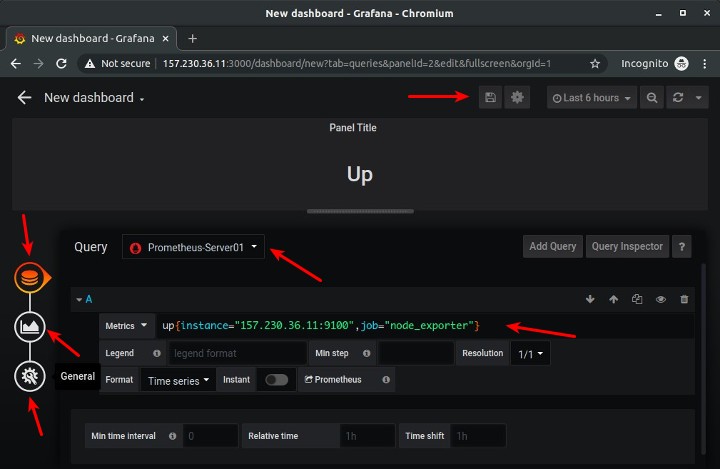
- Click Queries, at Query choose data source Prometheus.
- At Metrics enter up{instance=”NODE-EXPORTER-IP:9100″,job=”node_exporter”}.
- Click General, at Title enter title panel Status.
- Click Save
- Enter Dashboard name, Save.
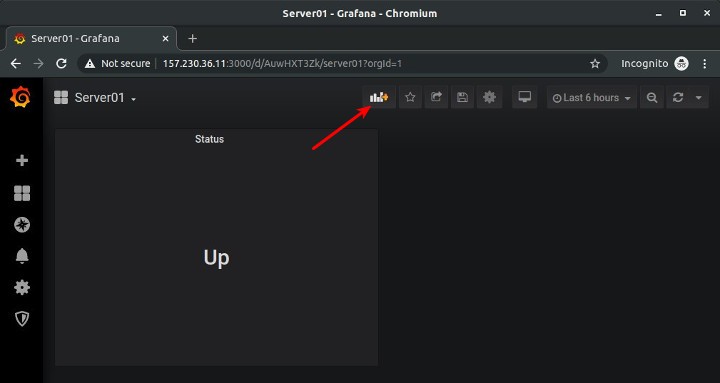
5.Add Panel
Add a new panel to monitor other resources, for example to monitor CPU usage.
- Click Add Panel.
- Click Choose Visualization.
- Click Graph.
- At Axes, Unit percent (0-100).
- At Legend, As Table = on, Current = on.
- Click Queries, Queury choose data source Prometheus.
- At Metrics, masukkan 100 – (avg by (instance) (irate(node_cpu_seconds_total{instance=”NODE-EXPORTER-IP:9100″,job=”node_exporter”,mode=”idle”}[5m])) * 100).
- Click General, Title enter CPU Used.
- Click Save.
- ESC.
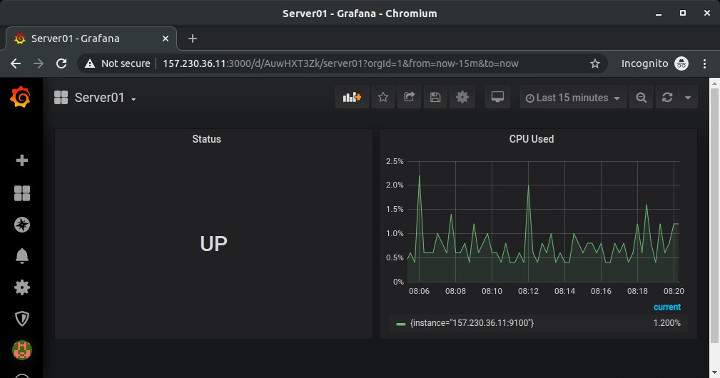
Add panels according to the needs of the monitoring system. Noteworthy is the selection of visualizations, metrics, and units.
If you found this article helpful and would like to support my work, consider making a donation through PayPal. Your support helps me continue creating useful content and tutorials. Thank you!
Donate via PayPal: https://paypal.me/musaamin