How to Install Prometheus for System Monitoring on Ubuntu 18.04

Prometheus is an open source monitoring and alerting toolkit originally developed by SoundCloud. Prometheus joined the Cloud Native Computing Foundation in 2016. Prometheus has many metrics needed to monitor the system and can be combined with Grafana for visualization.
0.Create User
Create users for Prometheus and node_exporter.
1 2 | useradd --no-create-home --shell /bin/false prometheus useradd --no-create-home --shell /bin/false node_exporter |
Create a prometheus folder.
1 2 | mkdir /etc/prometheus mkdir /var/lib/prometheus |
Set user and group ownership folder.
1 2 | chown prometheus:prometheus /etc/prometheus chown prometheus:prometheus /var/lib/prometheus |
1.Download Prometheus
Download and extract Prometheus.
1 2 | curl -LO https://github.com/prometheus/prometheus/releases/download/v2.17.1/prometheus-2.17.1.linux-amd64.tar.gz tar xzvf prometheus-2.17.1.linux-amd64.tar.gz |
Copy the prometheus and promtool folders.
1 2 | cp prometheus-2.17.1.linux-amd64/prometheus /usr/local/bin cp prometheus-2.17.1.linux-amd64/promtool /usr/local/bin |
Set user and group ownership for prometheus and promtool.
1 2 | chown prometheus:prometheus /usr/local/bin/prometheus chown prometheus:prometheus /usr/local/bin/promtool |
Copy the consoles and console_libraries folders.
1 2 | cp -r prometheus-2.17.1.linux-amd64/consoles /etc/prometheus cp -r prometheus-2.17.1.linux-amd64/console_libraries /etc/prometheus |
Set user and group ownership of consoles and console_libraries folders.
1 2 | chown -R prometheus:prometheus /etc/prometheus/consoles chown -R prometheus:prometheus /etc/prometheus/console_libraries |
2.Configure Prometheus
Creating configuration files for prometheus.
1 | nano /etc/prometheus/prometheus.yml |
Contents of prometheus.yml. At the target enter the server’s IP address.
1 2 3 4 5 6 7 | global: scrape_interval: 15s scrape_configs: - job_name: 'prometheus' scrape_interval: 5s static_configs: - targets: ['45.77.252.94:9090'] |
Set user and group ownership prometheus.yml
1 | chown prometheus:prometheus /etc/prometheus/prometheus.yml |
3.Prometheus Service
Create service for prometheus.
1 | nano /etc/systemd/system/prometheus.service |
Fill in the prometheus.service file.
1 2 3 4 5 6 7 8 9 10 11 12 13 14 15 16 17 | [Unit] Description=Prometheus Wants=network-online.target After=network-online.target [Service] User=prometheus Group=prometheus Type=simple ExecStart=/usr/local/bin/prometheus \ --config.file /etc/prometheus/prometheus.yml \ --storage.tsdb.path /var/lib/prometheus/ \ --web.console.templates=/etc/prometheus/consoles \ --web.console.libraries=/etc/prometheus/console_libraries [Install] WantedBy=multi-user.target |
Activate prometheus service.
1 2 3 4 | systemctl daemon-reload systemctl enable prometheus systemctl start prometheus systemctl status prometheus |
4.Download Node Exporter
Download and extract the Node Exporter.
1 2 | curl -LO https://github.com/prometheus/node_exporter/releases/download/v0.18.1/node_exporter-0.18.1.linux-amd64.tar.gz tar xzvf node_exporter-0.18.1.linux-amd64.tar.gz |
Copy node_exporter. Set node_exporter user and group ownership.
1 2 | cp node_exporter-0.18.1.linux-amd64/node_exporter /usr/local/bin chown node_exporter:node_exporter /usr/local/bin/node_exporter |
5.Node Exporter Service
Create service for node_exporter.
1 | nano /etc/systemd/system/node_exporter.service |
Fill in the node_exporter.service file.
1 2 3 4 5 6 7 8 9 10 11 12 13 | [Unit] Description=Node Exporter Wants=network-online.target After=network-online.target [Service] User=node_exporter Group=node_exporter Type=simple ExecStart=/usr/local/bin/node_exporter [Install] WantedBy=multi-user.target |
Activate node_exporter service.
1 2 3 4 | systemctl daemon-reload systemctl enable node_exporter systemctl start node_exporter systemctl status node_exporter |
6.Configure Prometheus for Exporter Nodes
Open the prometheus.yml configuration file.
1 | nano /etc/prometheus/prometheus.yml |
Add jobs for node_exporter.
1 2 3 4 | - job_name: 'node_exporter' scrape_interval: 5s static_configs: - targets: ['45.77.252.94:9100'] |
The final result file prometheus.yml.
1 2 3 4 5 6 7 8 9 10 11 | global: scrape_interval: 15s scrape_configs: - job_name: 'prometheus' scrape_interval: 5s static_configs: - targets: ['45.77.252.94:9090'] - job_name: 'node_exporter' scrape_interval: 5s static_configs: - targets: ['45.77.252.94:9100'] |
Restart prometheus.
1 2 | systemctl restart prometheus systemctl status prometheus |
7.Adding Node Exporter
Prometheus can access metrics that are on other servers that have Node Exporter installed by adding the IP address in the configuration prometheus.yml. The IP address is installed in the job_name: ‘node_exporter’ – targets section.
1 2 3 4 5 6 7 8 9 10 11 | global: scrape_interval: 15s scrape_configs: - job_name: 'prometheus' scrape_interval: 5s static_configs: - targets: ['45.77.252.94:9090'] - job_name: 'node_exporter' scrape_interval: 5s static_configs: - targets: ['45.77.252.94:9100', 'IP_ADDR#2:9100', 'IP_ADDR#3:9100'] |
8.Access Prometheus
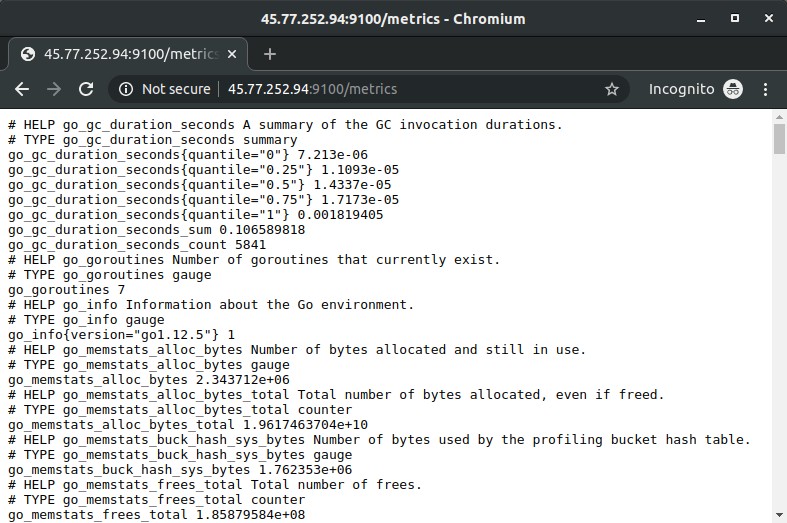
Browse http://SERVER-IP:9100/metrics to see which metrics are queries that can be run.
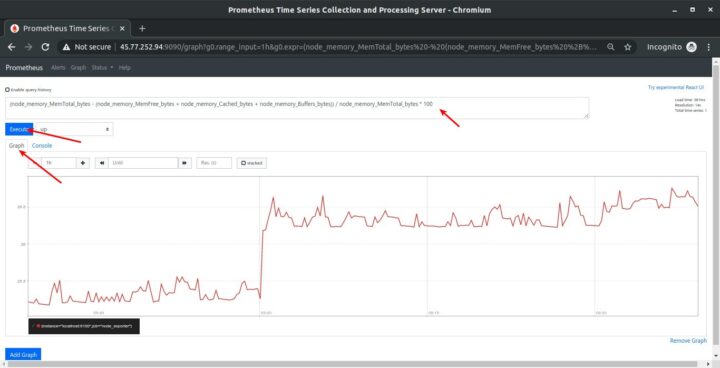
Browse http:// SERVER-IP:9090/graph to run the query metrics and visualize them in graphical form. Enter Expression, then click the Execute button to run the query metric, and click the Graph tab to display the query results in graphical form.
Example query
Total memory.
1 | node_memory_MemTotal_bytes{instance="45.77.252.94:9100",job="node_exporter"} |
Available memory.
1 | node_memory_MemAvailable_bytes{instance="45.77.252.94:9100",job="node_exporter"} |
Free space on partitions /.
1 | node_filesystem_avail_bytes{device="/dev/vda1",fstype="ext4",instance="45.77.252.94:9100",job="node_exporter",mountpoint="/"} |
If you found this article helpful and would like to support my work, consider making a donation through PayPal. Your support helps me continue creating useful content and tutorials. Thank you!
Donate via PayPal: https://paypal.me/musaamin